
In an earlier MindLink article we evaluated transfer pricing (TP) challenges facing distributors in multinational groups and the scope for using Berry ratios in assessing whether the value of a controlled transaction is arm’s length. In this article we look at a practical example of how Berry ratios can be used, as well as discussing requirements and conditions you need to consider when it comes to segmenting your financial data.
First off, let us figure out where the Berry ratio comes into play to defend fees charged in your related-party transactions. According to the OECD guidelines (January 2022 version) and the UN transfer pricing manual, the following criteria should be met:
1) The value of functions performed, which is created in a controlled transaction, is proportional to operating costs.
2) The value of goods being distributed doesn’t significantly affect the value of functions performed, meaning it’s not proportional to sales volumes.
3) As part of the controlled transaction being analysed, the taxpayer performs no other significant function (such as production) to be remunerated using another TP method or financial indicator.
Let us now take a look at how the Berry ratio can be applied to a Latvian wholesaler for TP purposes.
A Latvian-registered wholesaler (Company A) sells goods manufactured by other group companies to unrelated distributors on the local market. The company buys goods from the group’s related manufacturers in the US, Turkey and China.
Based on Company A’s geographical location, a strategic decision was made for it to make centralised purchases in the Baltic States and sell the goods on to related companies in Estonia and Lithuania, thereby easing the administrative burden of the related companies concerned (i.e. the group manufacturers as well as Lithuanian and Estonian wholesalers).
Figure 1. The group’s geographical location
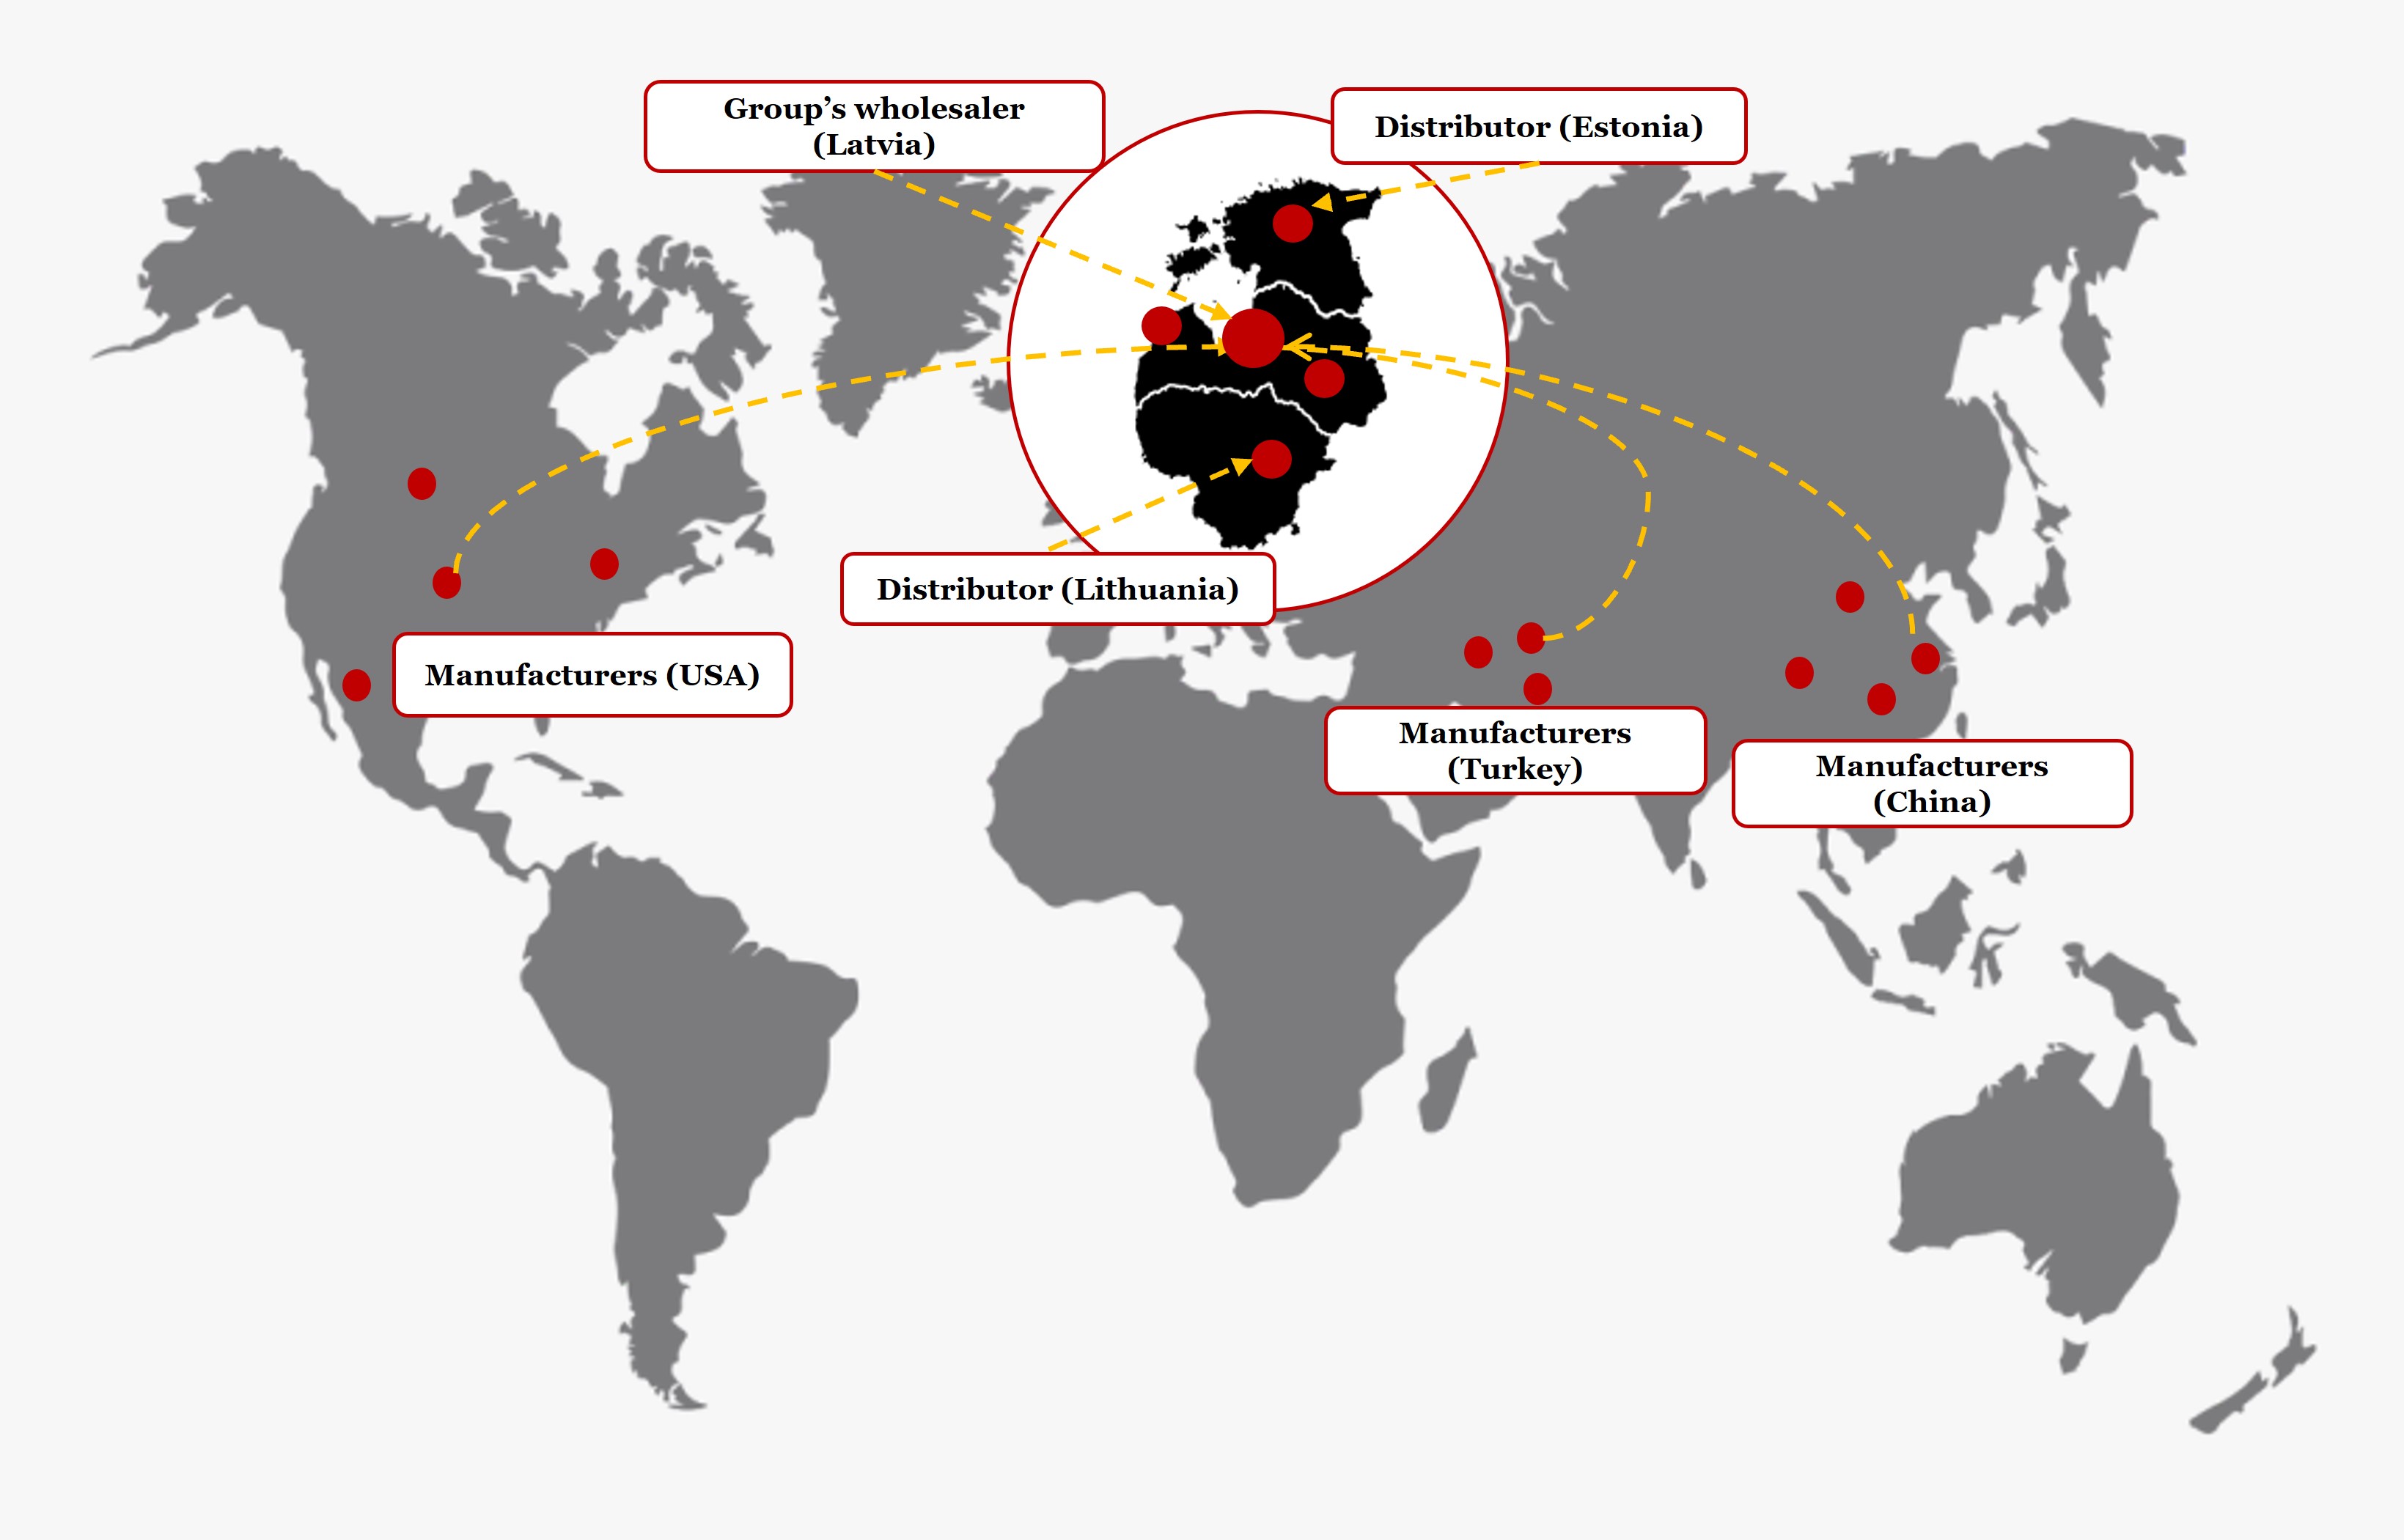 Table 1 shows Company A’s profit and loss (P&L) account for the financial year 2022:
Table 1
|
|
2022 (EUR) |
|
Net revenue (1) |
100,000 |
|
Cost of goods sold |
(61,500) |
|
Gross profit |
38,500 |
|
Selling costs |
(17,000) |
|
Administration costs, incl. |
(11,500) |
|
management services from group HQ |
(4,500) |
|
Other operating costs |
(2,000) |
|
Operating profit (2) |
8,000 |
|
Net margin (2/1) |
8.00% |
First off, a financial data segmentation was carried out to determine whether the price (value) set for Company A’s controlled transaction type is arm’s length.
The overall P&L financial data doesn’t give a full picture of how profitable Company A’s related-party transaction type is, so we need to separate the segment of sales to unrelated customers on the local market and the segment of sales to related companies in Lithuania and Estonia:
Table 2. Segmented financial data
|
Indicator |
Fin stats |
Sales to: |
||||
|
unrelated parties |
related foreign companies |
|||||
|
A Ltd |
B Ltd |
C Ltd |
LT |
EE |
||
|
Net revenue (1) |
100,000 |
21,000 |
38,500 |
10,500 |
20,000 |
10,000 |
|
Cost of goods sold |
(61,500) |
(12,250) |
(23,500) |
(6,000) |
(13,050) |
(6,700) |
|
Gross profit (3) |
38,500 |
8,750 |
15,000 |
4,500 |
6,950 |
3,300 |
|
Selling costs |
(17,000) |
(3,570) |
(6,545) |
(1,785) |
(3,400) |
(1,700) |
|
Administration costs, incl. |
(11,500) |
(2,820) |
(5,170) |
(1,410) |
(1,400) |
(700) |
|
management services from group HQ |
(4,500) |
(1,350) |
(2,475) |
(675) |
- |
- |
|
Other operating costs |
(2,000) |
(420) |
(770) |
(210) |
(400) |
(200) |
|
Operating profit (2) |
8,000 |
1,940 |
2,515 |
1,095 |
1,750 |
700 |
|
Operating cost (4) |
(30,500) |
(6,810) |
(12,485) |
(3,405) |
(5,200) |
(2,600) |
|
Profit margin (2/1) |
8.00% |
9.24% |
6.53% |
10.43% |
8.75% |
7.00% |
|
Berry ratio (3/4) |
|
|
|
|
1.34 |
1.27 |
It’s important to note that any other controlled costs that are capable of affecting the result (such as group management service fees or royalties for group licences) should be separated from operating costs in the Berry ratio calculation. So this segmentation of financial data involved placing management service fees in the segment of sales to unrelated parties.
The segmentation shows that Company A achieves Berry ratios of 1.34 and 1.27 in this controlled transaction type of selling goods bought from group manufacturers to related companies in Lithuania and Estonia.
A benchmarking study was also conducted to make sure the value of the controlled transaction type (i.e. the Berry ratio) is arm’s length. Table 3 summarises the results of benchmarking analysis:
Table 3. The arm’s length range of Berry ratios for 2022
|
Arm’s length range |
Berry ratio 2022 |
|
Minimum value |
0.76 |
|
Bottom quartile |
1.03 |
|
Median |
1.34 |
|
Top quartile |
1.68 |
|
Maximum value |
2.47 |
|
Number of comparable companies |
6 |
A comparison of Company A’s segmented financials with the arm’s length range of Berry ratios shows that the Berry ratio for the transaction with Lithuanian and Estonian related companies is arm’s length.
Using the Berry ratio for TP purposes tends to be a more appropriate and reliable approach for multinational group wholesalers whose revenues and costs are affected by controlled purchases and sales. Yet this might raise the question of whether financial data is available at gross level. What we see in practice is that gross-level financial data is available from commercial databases on Latvian and Lithuanian companies, so it’s possible to select comparable companies and make reliable Berry ratio calculations.
It’s also worth mentioning that our evaluation of published court cases dealing with multinational TP issues has discovered a lack of case law on misuse of the Berry ratio for TP purposes. So, based on reliable analysis, using the Berry ratio poses no significant risks to taxpayers.
If you have any comments on this article please email them to lv_mindlink@pwc.com
Ask question


