
This article explores Microsoft’s data analysis software Power BI as well as its uses and advantages.
Power BI is a set of business intelligence services and apps that work together to make your unconnected sources of business data aligned, interactive, and visually comprehensive. Your method of data storage does not matter because Power BI can work with Excel spreadsheets and local or cloud-based databases. Power BI allows you to connect your data sources and to create and share visualisations with your colleagues, using Power BI’s web version, which is accessible for use even from your smartphone. And all these things can be done without any programming knowledge because Power BI is very intuitive and its interface is similar to other Microsoft Office products.
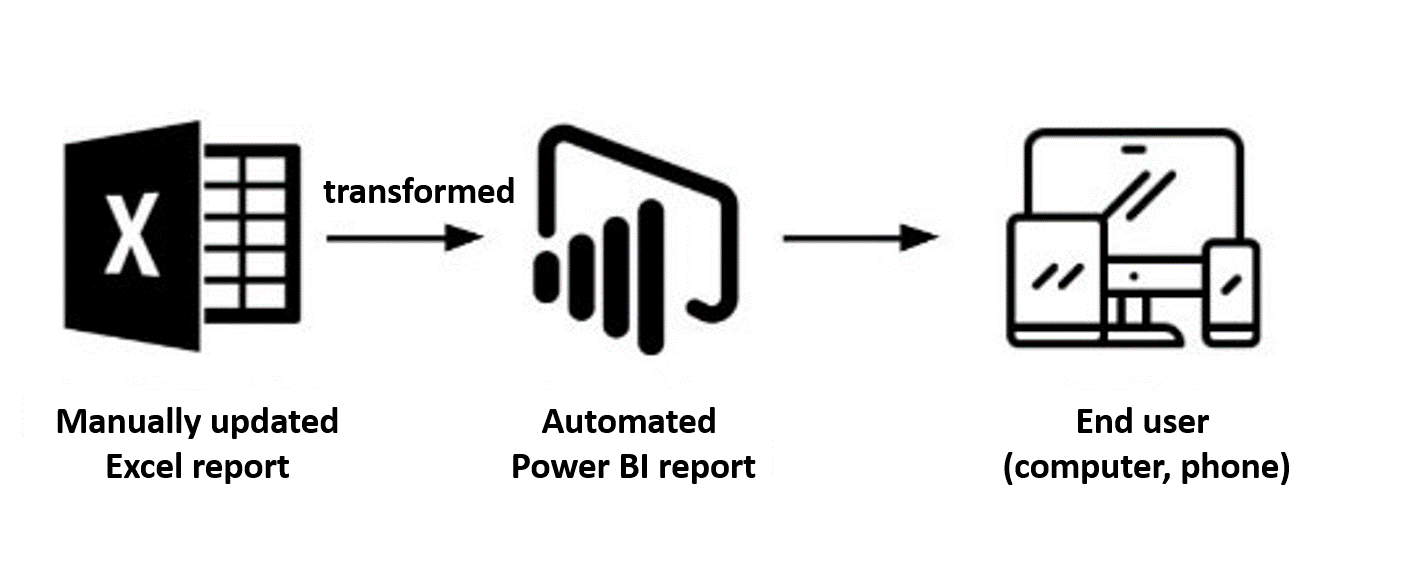
Various types of reports are often created in Excel spreadsheets, which need manual updating for each period and do not offer interactive data visualisation. In the digital era, with the amount of available data growing exponentially, Excel spreadsheets are no longer sufficiently functional. The need for automation, interactivity and remote accessibility is a problem that Power BI tackles.
A visualisation panel the World Health Organisation has created for the global Covid-19 situation provides an overview of Power BI’s capabilities here.
Power BI is already enabling millions of users to create automated reports that can be accessed from any device. This business intelligence tool is intended for companies needing to trace their key indicators and processes and to analyse large amounts of data or share results using secure online reports.
In recent years the interest of organisations in this software has risen rapidly: in 2020 Power BI was used by over 150,000 organisations worldwide.
Power BI has a variety of uses. The strength of this app lies mainly in its ability to cover the entire data processing cycle – gathering, processing, and visualising.
Power BI has the following advantages:
More and more financial teams are moving towards digitalisation and starting with the automation of their reports, which change from a traditional format (Excel, Word, PowerPoint) to one of the more advanced solutions (e.g. Power BI, Tableau, Qlik Sense). These business intelligence tools take the regular creation of reports out of your work routine, as data is retrieved from, say, Microsoft Dynamics 365 ERP systems and shown to the report user in real time. These solutions are automatic – a report is prepared once, stays up to date and can always be used.
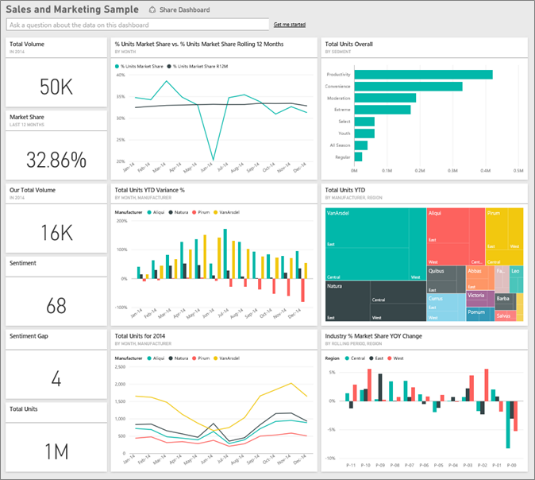
A real-time trading report
It is obvious that the accessibility of real-time information is very valuable. Before the advent of Power BI, obtaining a real-time insight into data required complex and expensive IT systems specially designed for the company’s needs. Since 2014 Power BI has made it possible for everyone to create real-time reports and analyses.
As well as enabling you to create a direct connection with various data sources simultaneously, Power BI lets you quickly summarise that data even if the data set is huge. Instead of preparing several complex and cumbersome Excel spreadsheets, you can create, for instance, a Power BI trading panel, which is remotely accessible to selected persons. So the outcome is a remotely accessible, interactive and always up-to-date report on trade in your company and a smooth reporting process.
Figure 1
A management report
An organisation with a large headcount would certainly benefit from creating a report for human capital management.
Figure 2. PricewaterhouseCoopers SIA sample report
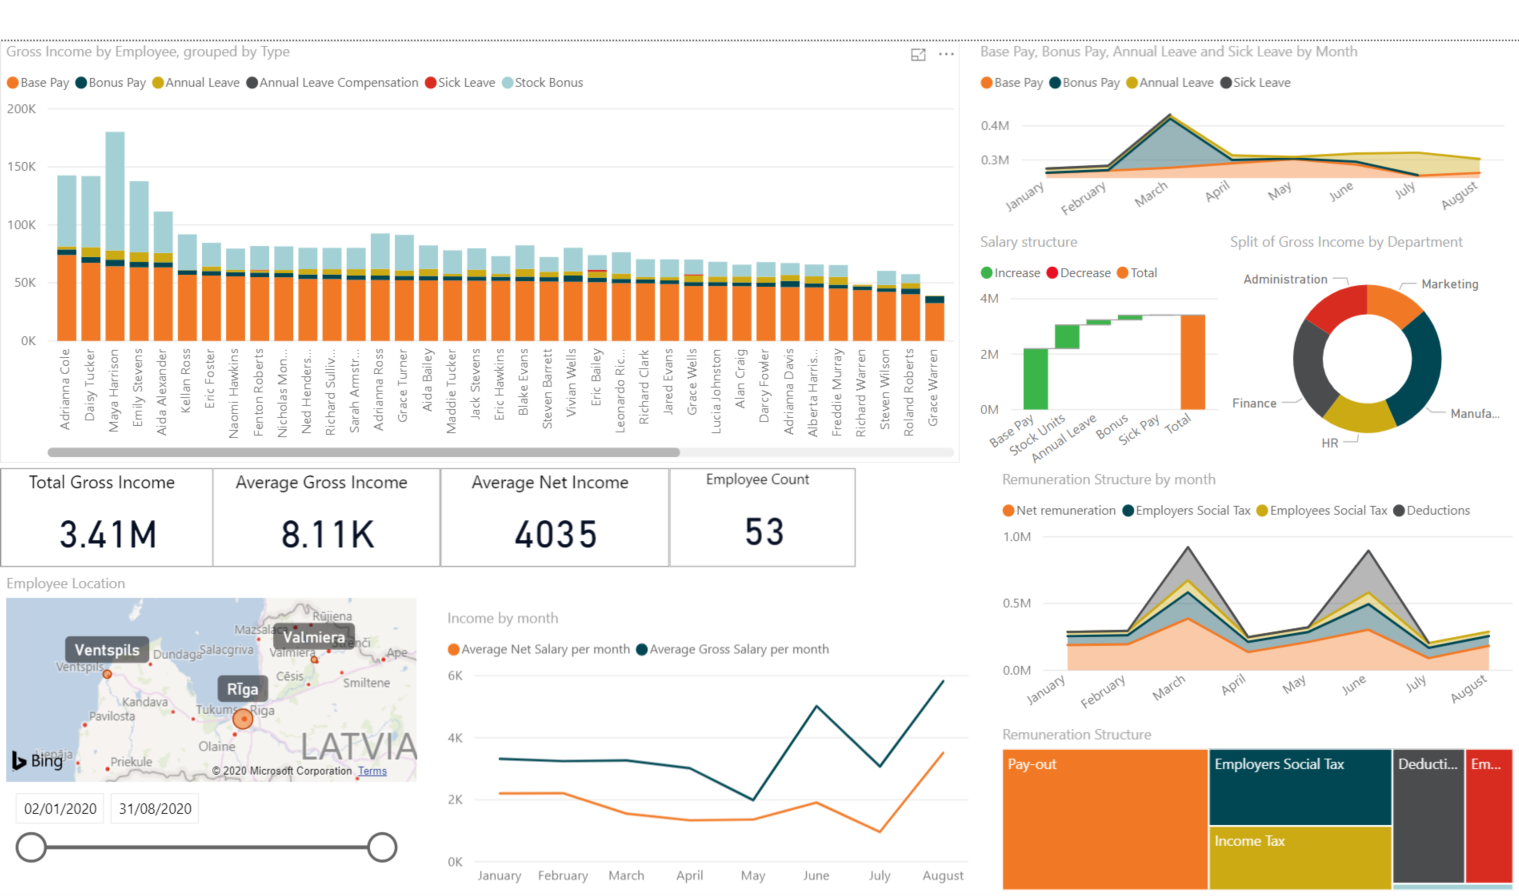
The picture shows a sample report that PricewaterhouseCoopers SIA has created on a company’s staff remuneration packages. Power BI makes it easy to track the gross and net amounts paid to each employee, as well as their vacation pay, bonuses and other fees, and the data can be interactively filtered by date, staff location, or function. Power BI also allows you to create various calculations in addition to available data, for instance, comparing an employee’s performance with their goals, making various KPI calculations etc.
These ways of using Power BI are extremely suitable for financial data management and analysis, yet Power BI also offers a wide range of services for data management. This is considered an indispensable financial management tool for large companies with huge amounts of financial data and its potential untapped. Of course, there are several alternatives (e.g. Google Data Studio, Looker, Tableau, Qlik Sense, Holistics) but Power BI has taken off as one of the biggest business intelligence tools worldwide.
If you have any comments on this article please email them to lv_mindlink@pwc.com
Ask question


