
When it comes to performing accounting or any other duties where data processing takes a long time or where you regularly need to perform some repetitive or similar activities and processes, it’s great to keep easy-to-use tools handy. As we are putting together courses at PwC’s Digital Academy, we would like to tell you about a tool that will make your daily tasks much easier to do. Power Query is a data preparation and transformation tool available in Microsoft Power BI and, starting from the 2016 version, in Microsoft Excel and other programs. This tool allows users to obtain data from a variety of external data sources and from files stored on computer. It allows you to group and transform data and perform other activities. This article offers a few practical examples to raise awareness of how this functionality can be used and what benefits it offers.
This tool makes it easy for you to process and transform data and use grouped data for analysis. The original data in the source remains unchanged. All you need to do is create steps for processing a particular data source only once, and those steps will be saved. Next time you work with data for, say, the following month, all you need to do is press “Refresh” and all the steps completed before will be replicated, so you no longer have to do the data processing.
The tool has an easy user interface and you can see what data processing steps for a data source have been completed. To perform data transformation steps, you do not require any programming knowledge, as data transformation activities can be selected from the toolbar.
While Excel has a limit of about 1 million rows, Power Query can use data sources exceeding 2 and more million rows. This does not mean you can visualise in a table all the rows in detail without preliminary data processing, but you can group data with Power Query and show the end result in Excel tables.
The Excel toolbar features Power Query in the “Get & Transform Data” section of the “Data” group. After selecting “Get Data”, you can select “Launch Power Query Editor”. If you choose to load data, say, “From Text/CSV”, the same section also offers the “Transform Data” menu, which will open Power Query for you.
1. Data processing, grouping and showing the result in a table
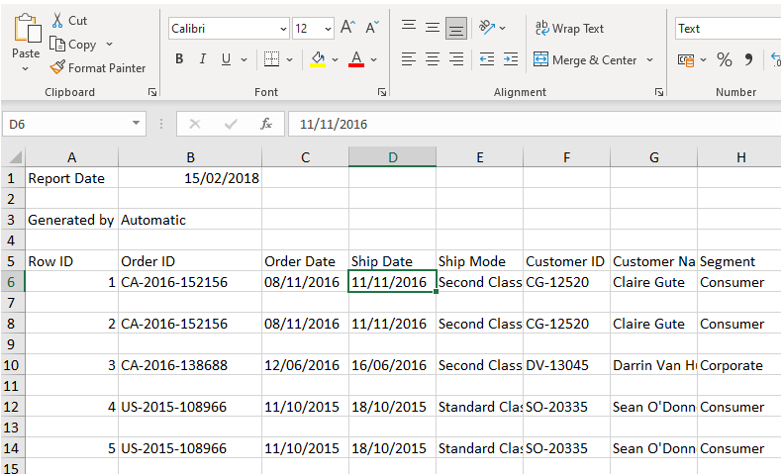
This example uses data (20,000 rows) of which the top four rows are deleted, and the date is formatted as Text, so this should first be transformed in order to group by date and have an empty row after each data row:
To create a template for processing this data with Power Query, in a new Excel file you select this file as a data source then perform the required steps to achieve the result you want:
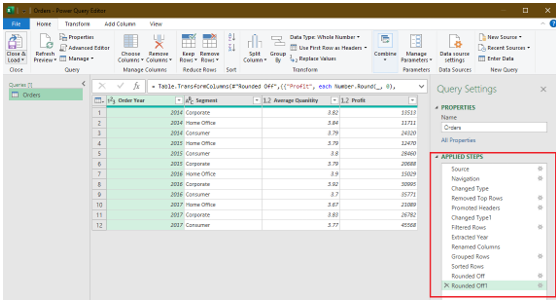
The right-hand side shows what transformation steps have been applied to the original data, for example:
As a result, the Excel table shows the final data grouped:
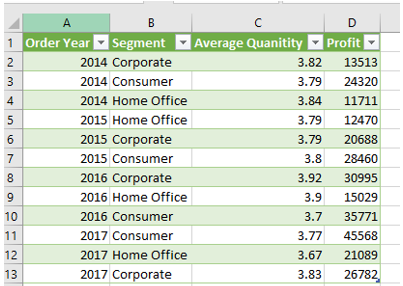
Next time you receive this data, all you need to do is press “Refresh” and all the steps set up by Power Query will be replicated automatically.
2. Foreign exchange rates in an Excel table from an external data source
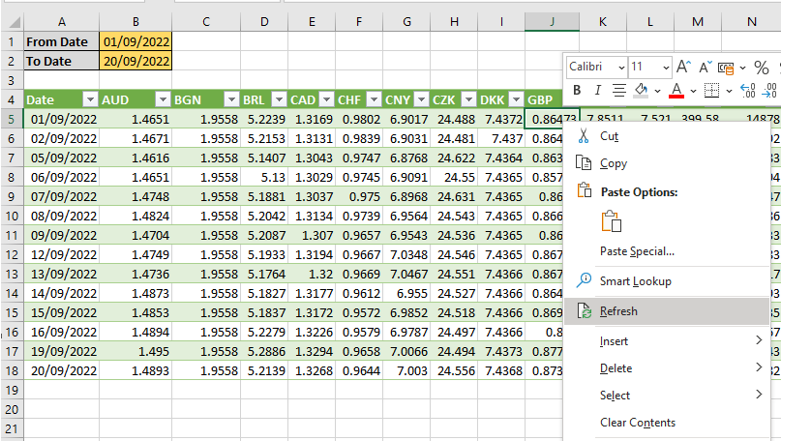
Another example of using Power Query involves connecting to an external source and loading from it, say, exchange rates for a certain period into an Excel file. The Power Query functionality also allows you to create a template where you state the period for which data need refreshing. In this example, changing the date in cells B1 and B2 and refreshing the table data with “Refresh” will refresh the exchange rates for the chosen period:
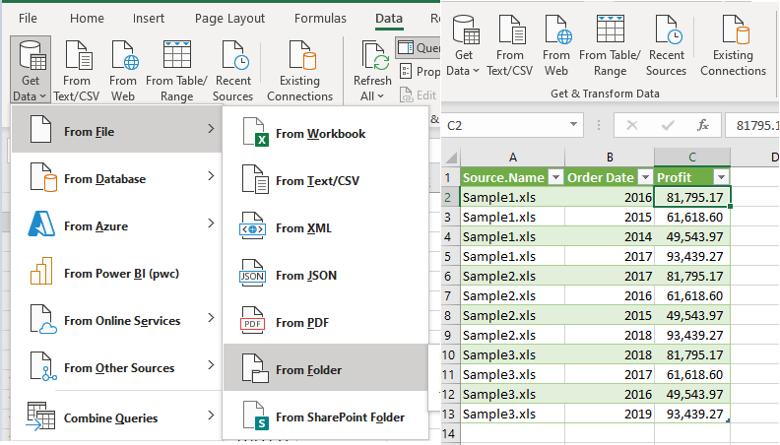
3. Loading data from multiple files with the same layout
This tool allows you to automatically merge files with the same layout from one folder and load them into a single table after completing any necessary data processing. In that case, all you need to do is choose the folder containing all the files, and Power Query will automatically create steps to merge the data into a single table by creating a field with the name of the file the data came from:
This article describes just a small part of the functionality. It’s worth noting that this allows you to prepare templates for various reports, compare data between systems and do other tasks. This tool allows you to replace a series of standard operations that you normally perform yourself when creating formulas, copying data or doing other activities.
If you are interested in using this or similar tools in your situation, you are welcome to send in your examples. We are about to ask every interested person to take part in PwC’s Digital Academy soon, where we will be presenting solutions to your situations.
If you have any comments on this article please email them to lv_mindlink@pwc.com
Ask question


